Web analytics: Meaning, Key metrics & How to get started
Web analytics is basically your website’s way of telling you what’s going on. It shows how people find your site, what they do once they’re there, and where you’re losing them.
Instead of guessing what’s working, analytics gives you real data you can use to make better decisions, whether you’re focused on product, UX, marketing, or growth.
In this guide, you’ll learn what web analytics actually means, why it’s important, and how to use it to improve performance. We’ll cover key metrics, popular tools, and simple steps to help you turn data into action.
By the end, you’ll know how to use web analytics to understand your audience and make smarter moves that drive results.
What is Web Analytics?
Think of your website like a busy store.
People walk in, look around, check out a few aisles, maybe buy something, or maybe just leave. Now imagine trying to understand your store’s performance without cameras, sales data, or even a clue about which products people touched before they left. You’d be guessing, right?
Now think about that for your website. Web analytics is the digital version of watching how customers move through your store — except instead of camera records, you’ve got data. It tracks who’s visiting, what they click on, how long they stay, and what finally convinces them to buy or bail. Every scroll, click, and page view adds up to a story about what your audience really wants.
In short, web analytics helps you move from “we think” to “we know.” It's about numbers and patterns. It shows you what people care about and what’s holding them back, so you can make decisions that actually improve results instead of relying on gut instinct.
Why Web Analytics is Important for Your Online Business
Every online business runs on two things: attention and action. Web analytics shows you whether your site is earning attention and converting that attention into actions like sales, leads, or whatever success looks like for you. Without it, you’re driving blind, no map, no dashboard, just vibes..
For product managers, analytics highlights which features people actually use and which ones just look good on the roadmap. For UX designers, it exposes friction points like confusing buttons or drop-off spots, so you can fix what’s breaking the experience. Marketers use it to see which campaigns bring in real traffic and which ones just burn budget. And data analysts pull all of it together to uncover trends that drive smarter strategy across teams.
When everyone’s looking at the same data, you stop arguing over opinions and start working and making decisions based on facts.
In short, analytics helps you see the story behind the numbers. Where users are happy, where they’re frustrated, and where you can make the biggest impact.
What Web Analytics Can Tell You About Your Business
Web analytics explains why things happen the way they do. Here’s what it can tell you:
-
Where your traffic really comes from. See how much of your audience finds you through Google, social media, ads, referrals, or direct visits. This helps you know which channels deserve more investment.
-
What content performs best. Learn which pages get the most attention, which ones convert, and which ones barely get noticed. This shapes your content and SEO strategy.
-
Where users drop off. Pinpoint where visitors stop engaging; maybe your form is too long, or your mobile checkout is buggy. Fixing these friction points can dramatically improve results.
-
Who your best customers are. Segment your visitors by behavior, geography, or device type to identify loyal, high-value users.
-
How your site performs technically. Page speed, mobile usability, and bounce rates all show how well your site runs and whether slow load times are costing you visitors.
-
Which products or offers drive the most interest. Analytics tools can show which listings get viewed most often, helping you adjust pricing, inventory, or promotions.
-
How changes impact results. Whether you updated your homepage, launched a new campaign, or tweaked your pricing, analytics show whether the change helped or hurt.
-
Customer journey insights. You can see how users move through your site from the landing page to checkout, revealing opportunities to simplify the path to conversion.

-
Behavior signals like rage clicks or scroll depth. These subtle cues tell you where users are getting frustrated or losing interest, so you can fix issues before they affect sales.
-
Seasonal or trend patterns. Over time, analytics helps you spot recurring cycles in traffic or behavior, letting you plan promotions or updates ahead of time.
When you pull all this together, web analytics becomes more than just numbers on a dashboard. It becomes your roadmap showing where to double down, where to fix leaks, and where your next growth opportunity might be hiding.
Key Web Analytics Metrics to Monitor
Every website has goals. Sales, sign-ups, downloads, or engagement. But without tracking the right metrics, it’s impossible to know whether you’re actually moving toward those goals or just spinning traffic wheels. These are the key metrics that web analytics can help you see:
1. Traffic Sources
Traffic sources tell you where your visitors come from: search engines, social media, paid ads, referrals, or direct visits. Understanding this helps you see which marketing channels drive the most qualified visitors. For example, if your highest conversion rate comes from email, that’s a sign to double down there instead of pouring more into paid ads.
2. Bounce Rate
Bounce rate measures how many visitors land on a page and leave without doing anything else. A high bounce rate can signal that your page isn’t meeting expectations, loads too slowly, or fails to give users a clear next step.
3. Average Session Duration
This shows how long visitors spend on your site. More time often means stronger engagement, but context matters. A long session on a blog is great; a long session on a checkout page could signal confusion. The goal is to interpret the “why,” not just stare at the number.
4. Pages per Session
This metric shows how deep people go into your website before they leave. If users explore multiple pages, it means your content flow or navigation is working. If they don’t, maybe your site’s structure or calls-to-action aren’t leading them anywhere.
5. Conversion Rate
Conversion rate tracks how many visitors complete a desired action, like buying a product or signing up for a newsletter. It’s one of the most valuable metrics for business growth because it reflects the bottom line: how effectively your website turns interest into revenue.
6. Exit Pages
Exit pages tell you the last page users visit before leaving your site. Knowing where people drop off can help you fix friction points—maybe your pricing page needs more reassurance, or your checkout form asks for too much information.
7. New vs. Returning Visitors
This ratio tells you how well your site attracts fresh audiences and keeps old ones coming back. Too many new visitors with few returning ones might mean people don’t find enough value to revisit. Repeat visitors usually signal loyalty or strong content.
8. Device and Location Data
Understanding what devices and locations your visitors use is critical for optimizing experience. If 70% of your users are on mobile, you’d better make sure that mobile layout loads fast, looks sharp, and customers are able to complete actions from their mobile devices. If most of your sales come from one country, maybe it’s time to localize your content for that audience.
Why These Metrics Matter Together
Each of these numbers tells part of the story. But the real power comes from connecting them. A sudden traffic spike paired with a falling conversion rate might point to irrelevant ad traffic. A low bounce rate and longer session duration might mean your content strategy is finally clicking.
Metrics only matter when they translate into business decisions; where to invest, what to improve, and how to turn visitors into loyal customers. Web analytics gives you that clarity, one metric at a time.
Top Web Analytics Tools
There’s no shortage of web analytics tools out there, but some actually make sense for business owners who want data they can use, not just data that looks pretty on a dashboard. Here’s a breakdown of eight tools worth knowing, from the classics to the newer players built for how people actually run online businesses today.
1. Google Analytics 4 (GA4)
The old reliable. Google Analytics 4 is still the go-to for most marketers, mainly because it’s powerful, free, and deeply integrated with Google Ads and Search Console. It tracks how people find your website, what they do once they’re there, and whether they convert.

But GA4 can feel like you’re flying a spaceship; tons of dashboards, menus, and jargon. Once you get past that, though, it gives you the kind of deep insights that big brands live by: user journeys, funnel drop-offs, and real-time data that help you adjust strategy before traffic trends slip away.
2. Seline Analytics
Seline Analytics is built for people who want web analytics that feel simple, modern, and actually readable. It focuses on showing what matters most: key traffic trends, engagement, and e-commerce performance without the chaos of 50 different reports.

Seline’s dashboard feels more like a concise story than a spreadsheet. You instantly see which pages drive revenue, where customers drop off, and what products are getting attention. It’s like the TL;DR of web analytics with an option to dig deeper into more data if you want. It's perfect for SaaS, e-commerce, and small businesses that want to start with clear, actionable metrics instead of drowning in data complexity.
Get started with web analytics for free.
Sign up for Seline now - no credit card required. Cookieless, privacy-friendly, independent.
Get started
It’s also free until your traffic really scales, which makes it a no-brainer for new businesses trying to get serious about analytics without committing to enterprise-level pricing.
3. Matomo
Matomo is what you get when privacy and control come first. It’s open-source and self-hosted, meaning you own your data completely; no third parties are tracking your users behind the scenes. It’s a favorite among organizations that take GDPR compliance seriously or want to keep analytics in-house.

Functionally, Matomo covers everything GA4 does: traffic tracking, goal conversion, heatmaps, and even session recordings. The difference? You decide where your data lives and who touches it. That level of transparency has made it a top choice for businesses that prioritize trust as much as traffic.
4. Hotjar
Hotjar focuses less on “how many” and more on “why.” It lets you watch how users move around your site through heatmaps and session recordings. You’ll see what they click, how far they scroll, and where their attention drops off.
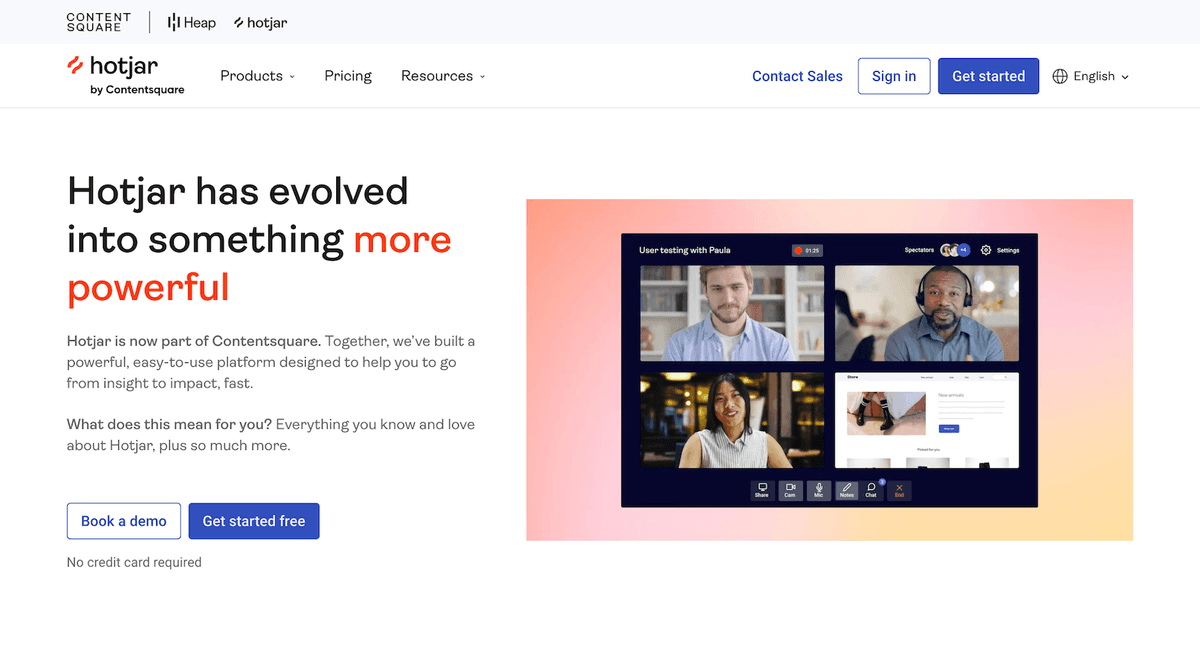
It’s a must-have for improving user experience, especially when paired with a traditional analytics tool like GA4 or Seline. Numbers can tell you that users are leaving; Hotjar shows you why they’re leaving.
5. PostHog
PostHog is an open-source analytics platform that’s growing fast with product-led companies. It tracks user behavior across websites and apps, giving you a deep view of how people actually use your product. Think of it as a blend of Mixpanel’s event tracking and Matomo’s data control.
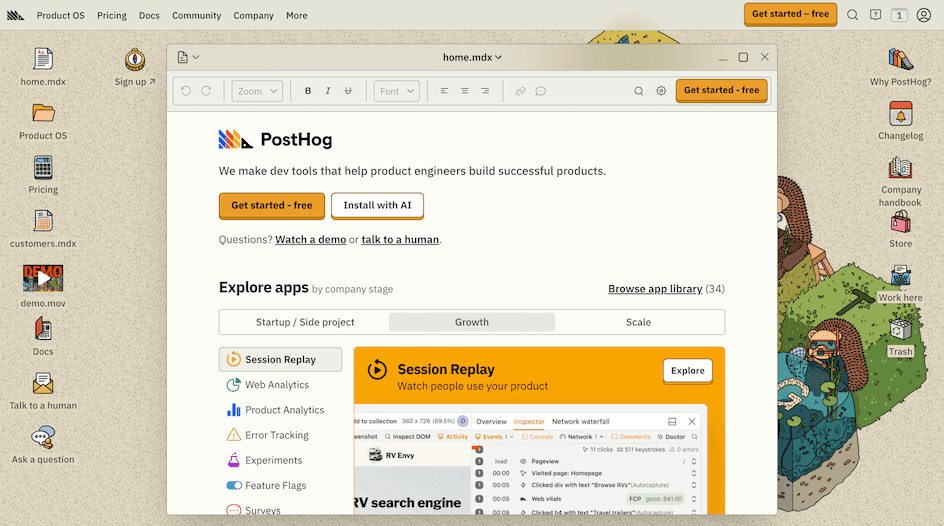
It’s also developer-friendly. You can host it yourself, integrate it with your stack, and even run experiments to test product changes. If you’re building a tech product or SaaS app, PostHog gives you serious flexibility.
6. Mixpanel
Mixpanel is built for understanding engagement. So you can see which features get the most use, how often people come back, and what separates your power users from one-time visitors.

It’s fantastic for SaaS, e-commerce, and mobile apps that rely on recurring users. The dashboards are sleek, interactive, and help you spot trends before they become problems. Mixpanel’s strength is in connecting user behavior to business outcomes.
7. Plausible
Plausible is the minimalist’s dream. It’s privacy-friendly, fast, and refreshingly simple. You get clean traffic data all without cookies or bloated scripts that slow your site down.

It’s great for content-focused businesses, agencies, or anyone tired of complicated setups. You don’t get every feature under the sun, but that’s the point. Plausible gives you only the essentials, presented beautifully.
8. Fathom Analytics
Fathom is another privacy-first tool that focuses on simplicity and transparency. It’s ideal for businesses that care about compliance but don’t want to self-host like Matomo. The dashboard is quite easy to read; one clean page showing your most important metrics at a glance.

It’s built for speed and clarity. No clutter, no cookies, and no user tracking drama. Just clean analytics that tell you what’s happening on your site right now.
Why Choose Seline for Web Analytics
Let’s be honest, most analytics tools feel like they were built for data scientists, not business owners. You open the dashboard, see fifty charts, and spend twenty minutes trying to figure out which one actually matters. Seline was made to fix that.
Seline strips away the noise and gives you exactly what you need to understand how your website performs, nothing more, nothing less. It’s clean, fast, and focused on clarity, not complexity.
1. Designed for Real People
You don’t need to be a data analyst to use Seline. Everything from the dashboard to the insights is built for everyday users: founders, marketers, and online store owners who just want to see what’s working. It’s analytics without the jargon, so you can spend less time decoding numbers and more time improving what matters.
2. Focused on the Right Metrics
Seline tracks the data that actually affects growth: traffic trends, conversion rates, customer behavior, and page performance. You’ll instantly see which channels bring visitors, which pages drive sales, and where users drop off. It connects the dots between your audience and your revenue.
3. Simple Pricing, No Surprises
You can start for free and pay only when your traffic scales. There’s no overcomplicated pricing matrix or hidden limits. Just straightforward access to the insights you need, when you need them. Whether you’re pulling in 50 visitors a week or 50,000, Seline scales effortlessly. You start free until your traffic picks up, and then the pricing adjusts based on growth, not some bloated enterprise plan. It’s analytics that fits your stage, not one that pressures you into upgrading before you’re ready.
4. AI-Powered Insights
Here’s where things get exciting. Seline comes with an AI assistant that lets you chat with your data just like you would with a real analyst.

You can ask anything:
- “Which channel brought in the most revenue this month?”
- “How long do users from France stay on the site on average?”
- “Which product pages are converting the best right now?”
The AI instantly pulls up the answer, backed by real data. No filters, no dashboards to click through, just straightforward, human-like responses. It’s one of Seline’s most loved features because it turns analytics from a chore into a conversation.
How to Get Started with Web Analytics
Starting with web analytics isn’t about drowning in charts or learning code overnight. It’s more like setting up the dashboard of a car; you just need to know which dials matter and how to read them before hitting the gas.
Here’s the simple roadmap:
1. Pick your tool (and stick with it for a bit) You don’t need to install five analytics tools to “see everything.” Choose one solid platform and get comfortable with it first. Learn where to find your traffic numbers, your conversion data, and which reports actually tie to your goals. Once you master one, you can layer others for heatmaps or deeper behavior analysis.
2. Define what success looks like Before you look at numbers, decide what “winning” means for your site. More sign-ups? More checkout completions? Lower bounce rate? The data will make a lot more sense when you’ve defined the outcomes you care about. Think of it like setting a GPS destination; otherwise, you’re just staring at a map.
3. Set up tracking the right way Tracking setup is where beginners often trip. Make sure your tags are installed correctly, your events are firing as expected, and your conversion goals are set. And if you’re using Seline, it’s plug-and-play, so that you can skip the messy tag manager drama.
4. Check your data regularly (but don’t obsess) Analytics isn’t a one-time setup; it’s an ongoing conversation with your site. Schedule a weekly or biweekly check-in to review performance—spot patterns. Ask why things changed. But don’t spiral into data paralysis. Trends matter more than day-to-day spikes.
5. Make small tweaks and watch the ripple The magic happens when you act on your data. Change one thing at a time: a headline, a CTA color, or a checkout step, and see what happens. That’s how you turn analytics into growth instead of another tab you never open.
Best Practices for Using Web Analytics Tools
The best marketers aren’t the ones with the fanciest dashboards; they’re the ones who can connect the dots between numbers and real business moves.
Here are some underrated best practices worth locking in:
1. Don’t chase vanity metrics Traffic is nice, but if those visitors bounce in five seconds, you’re just hosting a parade, not building a business. Focus on metrics that actually impact growth, like conversions, engagement time, repeat visitors, and revenue per user.
2. Segment everything Average data lies. Always break your reports down by traffic source, device, or location. A “good” average conversion rate might hide the fact that your mobile users are struggling or that one country is outperforming all others. Segments turn data into stories.
3. Use annotations or notes Whenever you make a major change, such as launching a campaign, redesigning a page, or running a promo, mark it in your analytics. Future-you will thank present-you when you’re trying to figure out why traffic suddenly spiked or dropped.
4. Pair quantitative with qualitative data Numbers tell you what’s happening, not why. That’s why combining analytics with session replays or surveys (Hotjar-style) gives you the full picture — the “what” and the “why” of user behavior.
5. Automate the boring stuff If you’re spending hours building reports, you’re doing it wrong. Use dashboards, alerts, or AI features like those in Seline to surface insights automatically. The goal isn’t to stare at data; it’s to act on it faster.
6. Always tie data back to revenue or retention The real test of good analytics is whether it helps you make or keep money. Every metric you track should tie back to either acquisition, conversion, or retention. If it doesn’t, it’s probably noise.
Frequently Asked Questions
1. How often should I check my web analytics? Weekly is a good baseline. You’ll catch trends early without overreacting to short-term blips.
2. What’s the easiest web analytics tool for beginners? If you want something minimal and AI-powered, Seline is built for that. It skips the setup complexity and shows you insights in plain English.
3. Can I use more than one analytics tool at the same time? Absolutely. Many businesses combine tools, for example, Google Analytics for overall traffic, Hotjar for behavior insights, and Seline for quick AI-powered analysis. Just make sure you don’t duplicate tracking events.
4. Why do my numbers look different across platforms? Different tools count sessions and events differently. Always compare trends, not raw numbers, across tools.
5. What are the most important metrics to monitor? Focus on traffic sources, conversion rate, bounce rate, session duration, and customer lifetime value. Those five alone can tell you almost everything about how your site’s performing.
6. How can AI improve web analytics? AI cuts out the busywork. Instead of digging through layers of reports, you just ask questions like “Which channel brought the most revenue this month?” and get instant, data-backed answers.