How to Use Google Analytics: A Practical GA4 Guide for 2026
Google Analytics is still the default answer when someone asks how to track a website. According to W3Techs, it sits on roughly 44% of all sites. The free plan is powerful. The problem is that "powerful" often means "hard to use."
If you opened Google Analytics 4 (GA4) and felt lost, you are not alone. The interface is dense. Metrics got renamed. Reports hide behind nested menus. And answering a basic question like "which page drove the most sign-ups last week?" can take longer than it should.
This guide shows you how to use Google Analytics the practical way: create a property, install tracking, verify data, set up the reports that matter, and mark the conversions you actually care about. I will also be honest about where GA4 shines, where it slows you down, and when a simpler tool like Seline is the better daily driver.
What you will learn
- How to set up a GA4 property and data stream
- How to install the tracking code (direct tag or Google Tag Manager)
- How to verify that data is flowing
- Which reports to open first (and what they mean)
- How to track key events (conversions)
- The setup mistakes that ruin beginner installs
- When Google Analytics is enough, and when it is overkill
What Google Analytics is (and what GA4 changed)
Google Analytics is a free analytics product from Google. It tells you where visitors come from, which pages they view, and which actions they take. The current version is Google Analytics 4. Universal Analytics (the older version) stopped collecting data for standard accounts in July 2023.
The biggest mental shift in GA4 is this: almost everything is an event.
- A page view is an event (
page_view) - A scroll is an event
- A form submit is an event
- A purchase is an event
What Universal Analytics called goals, GA4 now calls key events. Bounce rate took a back seat to engagement rate. Sessions still exist, but the way GA4 counts engaged users is different from the old "users" metric many people remember.
You do not need to master every report on day one. You need a clean install, a few trustworthy reports, and 2 to 5 key events that match your business goals.
If you want the bigger picture of what analytics should do for a site, start with what web analytics is and how to understand website analytics.
Before you start: what you need
You only need three things:
- A Google account
- Access to your website (or a developer who can add a snippet)
- About 30 focused minutes
Optional but useful:
- A Google Tag Manager account if you expect to add more tags later (ads pixels, A/B tools, multiple analytics tools)
- A verified Google Search Console property if you care about organic search queries
If your site runs on WordPress, Shopify, Webflow, Squarespace, or Wix, you can usually paste a Measurement ID into a settings field and skip editing theme files.
Step 1: Create a Google Analytics account and property
- Go to analytics.google.com and sign in.
- Click Start measuring (or Admin → Create → Account if you already have another account).
- Enter an account name. Most people use their company or website name.
- Choose your data sharing settings. You can leave Google's product improvement toggles on or off. They do not change your core reports.
- Create a property. Set:
- Property name (usually your site name)
- Reporting time zone (use the zone you actually operate in)
- Currency
- Answer the business details questions. They pre-fill some report suggestions. They do not lock you into anything permanent.
- Choose Web as the platform.
- Enter your website URL and a stream name, then create the stream.
GA4 will give you a Measurement ID that looks like G-XXXXXXXXXX. Copy it. You will need it for installation.
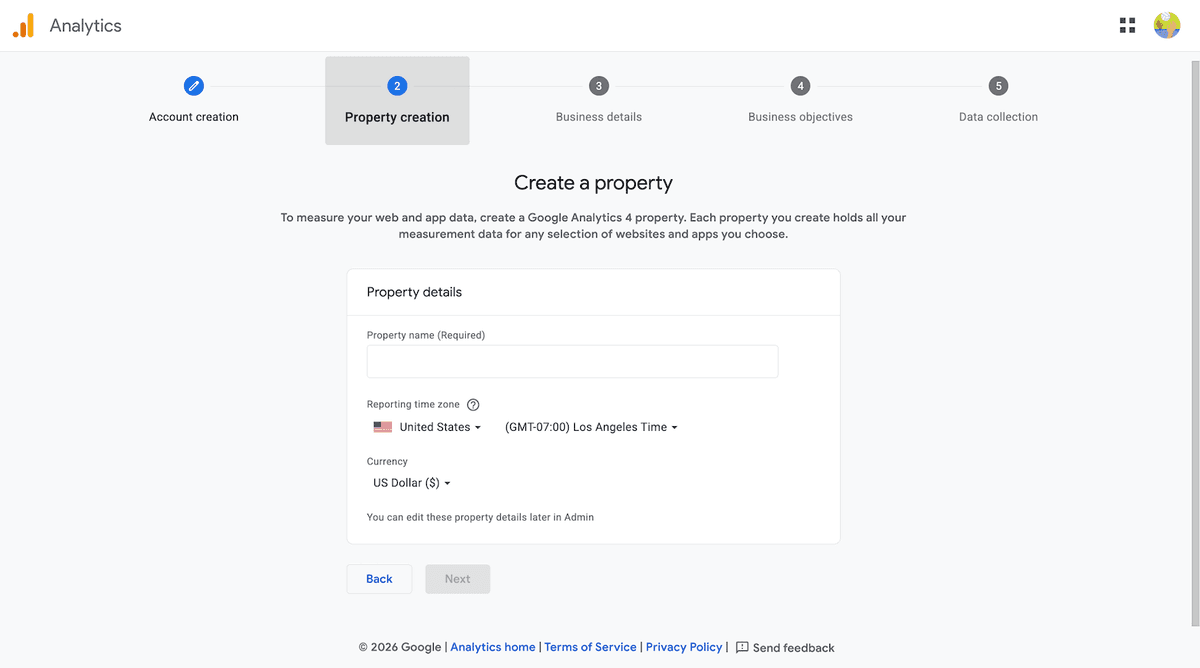

GA4 data collection step after creating a web stream.
Wrong time zone is a silent killer. If you set UTC by habit, every "today" and "yesterday" report will look off compared to your local marketing calendar.
Step 2: Install Google Analytics on your website
You have three common options. Pick one. Do not run a direct gtag snippet and Google Tag Manager for the same GA4 property at the same time, or you will double-count traffic.
Option A: Direct gtag.js snippet
Best for small sites with one analytics tool and no plans to add many other tags.
- Open your web data stream in GA4.
- Open the installation instructions and copy the global site tag (
gtag.js). - Paste it in the
<head>of every page, or in your site-wide header template. - Publish.
Option B: Google Tag Manager (recommended for most growing sites)
Best if you expect to manage GA4, ads pixels, and other tags without editing code every time.
- Create a container at tagmanager.google.com.
- Install the GTM snippet on your site.
- In GTM, create a new Google Tag.
- Paste your GA4 Measurement ID.
- Set the trigger to fire on Initialization - All Pages (or All Pages, depending on your GTM setup).
- Use Preview mode to confirm the tag fires.
- Publish the container.
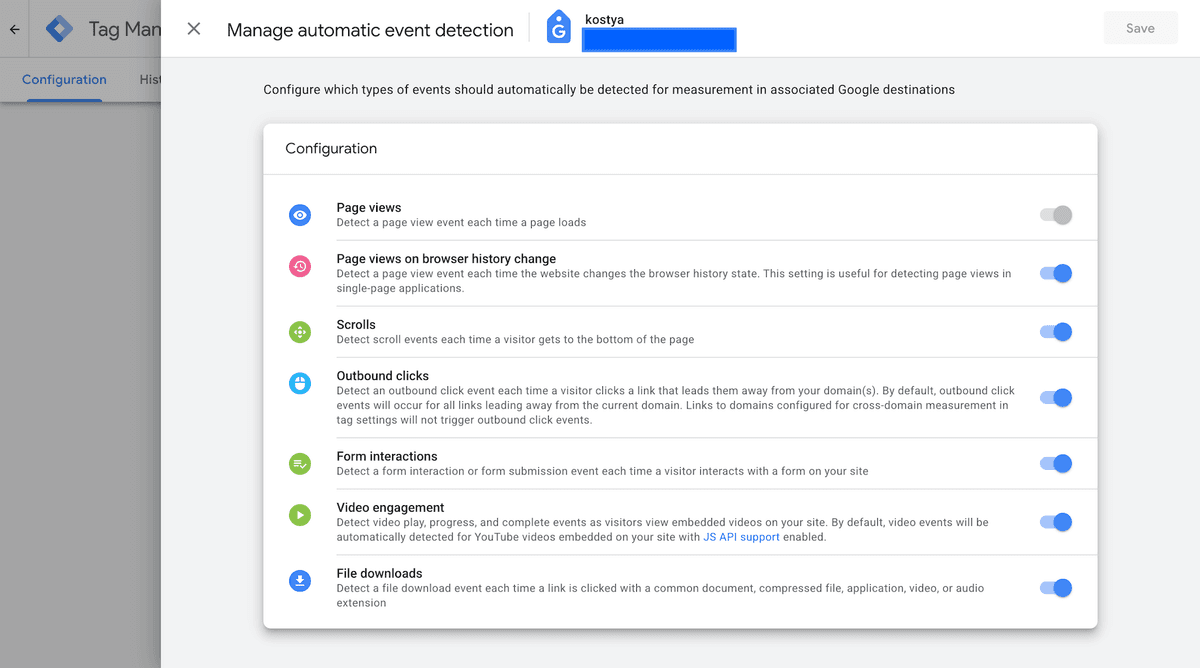
GTM automatic event detection: scrolls, outbound clicks, forms, and more.
Option C: Native CMS / platform field
Many platforms have a Google Analytics field. Paste the Measurement ID (G-...) and save. This is the fastest path for WordPress plugins, Shopify, Webflow, Squarespace, and similar builders. For WordPress specifically, see our WordPress analytics guide.
Step 3: Verify that data is flowing
Open your site in a new tab (ideally in an incognito window with ad blockers disabled). Then in GA4 go to Reports → Realtime.
Within about 30 seconds, you should see at least one active user. Click around a few pages. The realtime view should update.
If you see nothing after two minutes:
- Confirm the Measurement ID is correct
- Confirm the tag is on the live page (View Source or use the Google Tag Assistant)
- Disable ad blockers and privacy extensions for the test
- If you used GTM, confirm the container is published, not just saved in Preview
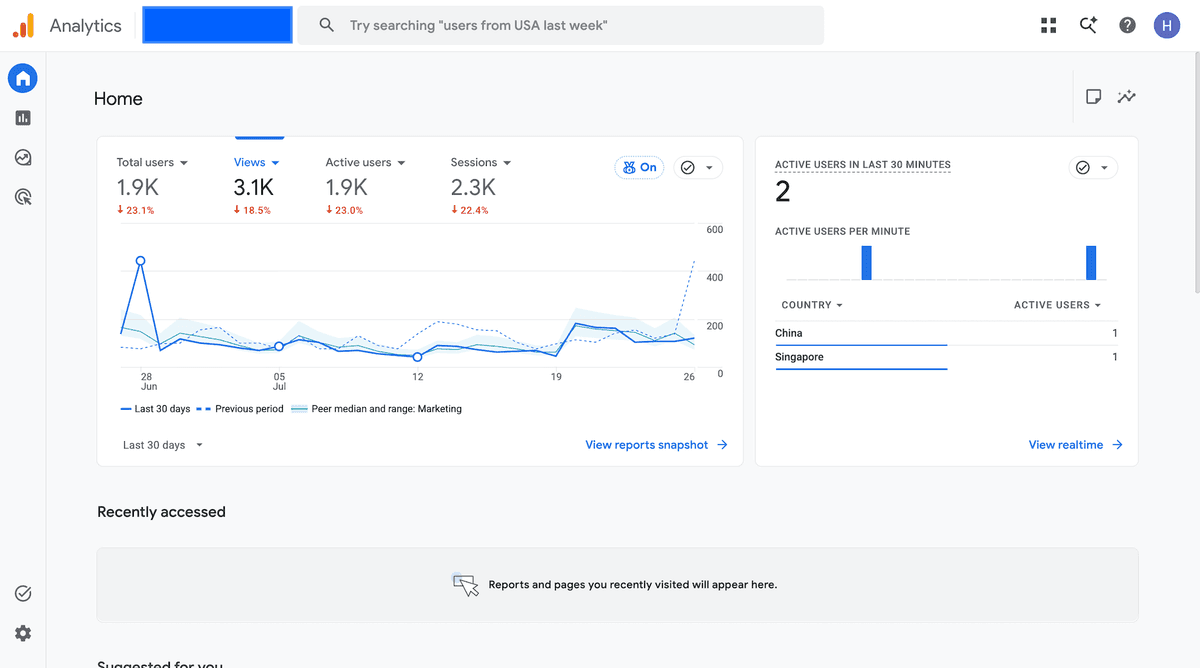
GA4 Home dashboard with the realtime active users card.
Realtime confirms the pipe works. Standard reports can lag, so do not panic if Acquisition looks empty for a few hours after a fresh install.
Step 4: Turn on Enhanced Measurement
Enhanced Measurement auto-tracks useful interactions without custom code:
- Scrolls
- Outbound clicks
- Site search (when your URL pattern is detected)
- Video engagement (for supported embeds)
- File downloads
Find it in Admin → Data collection and modification → Data streams → your stream → Enhanced measurement.
Leave the defaults on unless you have a reason to turn something off. This alone gets most small sites further than they expect without a developer.
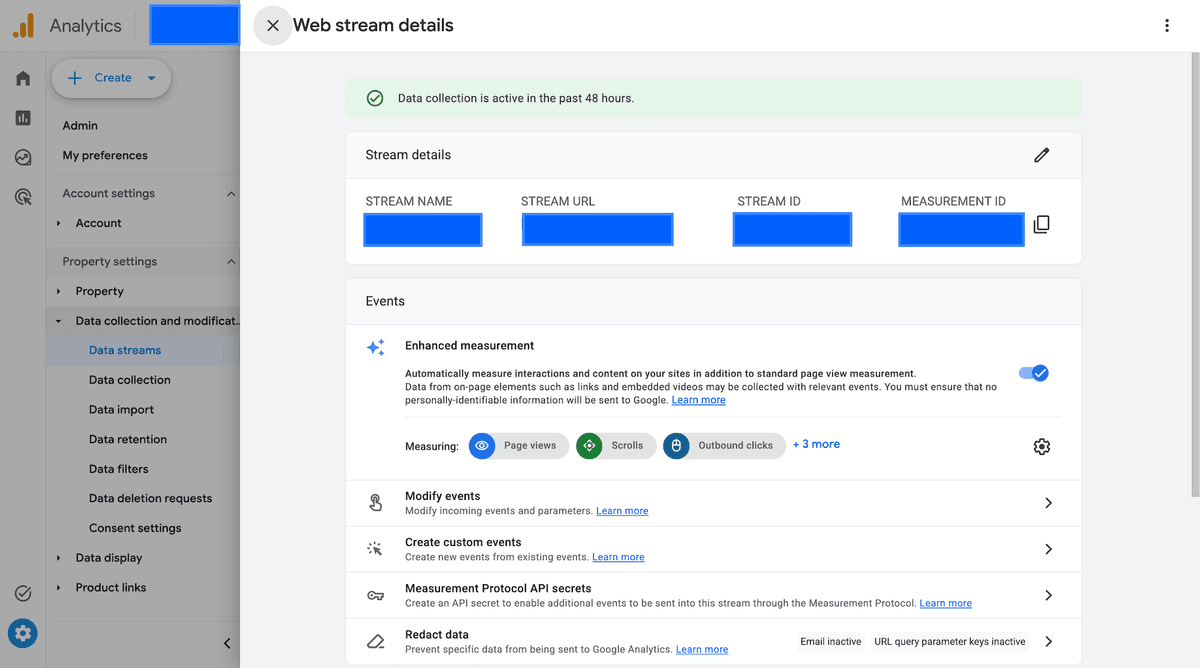
Web stream details with Enhanced measurement turned on.
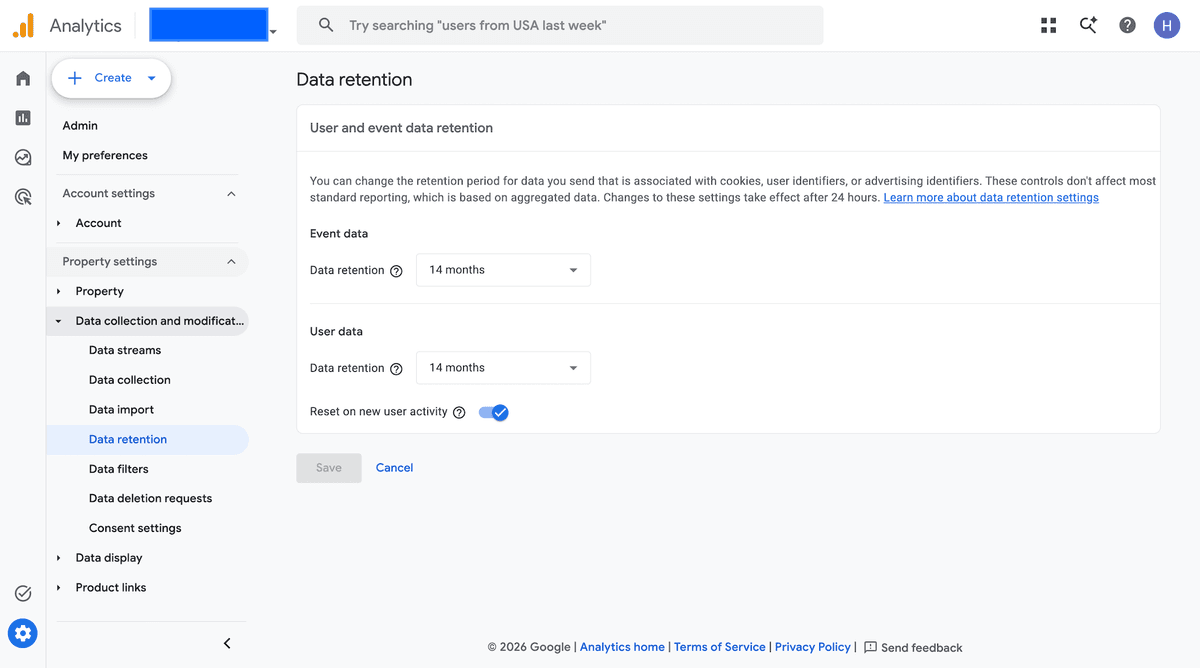
Step 5: Change data retention to 14 months
This is the setup step most beginners miss.
- Go to Admin → Data settings → Data retention
- Change event data retention from the default 2 months to 14 months
- Save
This mainly affects Explorations and some user-level analysis. Aggregated standard reports still work, but leaving retention at 2 months will frustrate you the first time you try a longer custom analysis.
Step 6: Mark your key events (conversions)
A key event is any action that matters to the business: a signup, a purchase, a demo request, a newsletter subscribe, a contact form send.
In GA4:
- Go to Admin → Data display → Events (wording can vary slightly by UI version)
- Find an event you already collect, or create a custom event
- Toggle Mark as key event
Start with 2 to 5 key events. More than that and your conversion reports get noisy fast.
Common starter set for a SaaS or content site:
sign_uporgenerate_leadpurchase(if you sell)form_submitor a named contact event- A high-intent CTA click if forms are not reliable yet
If you need event volume context later, we also wrote about Google Analytics event counts and dimensions in Google Analytics.
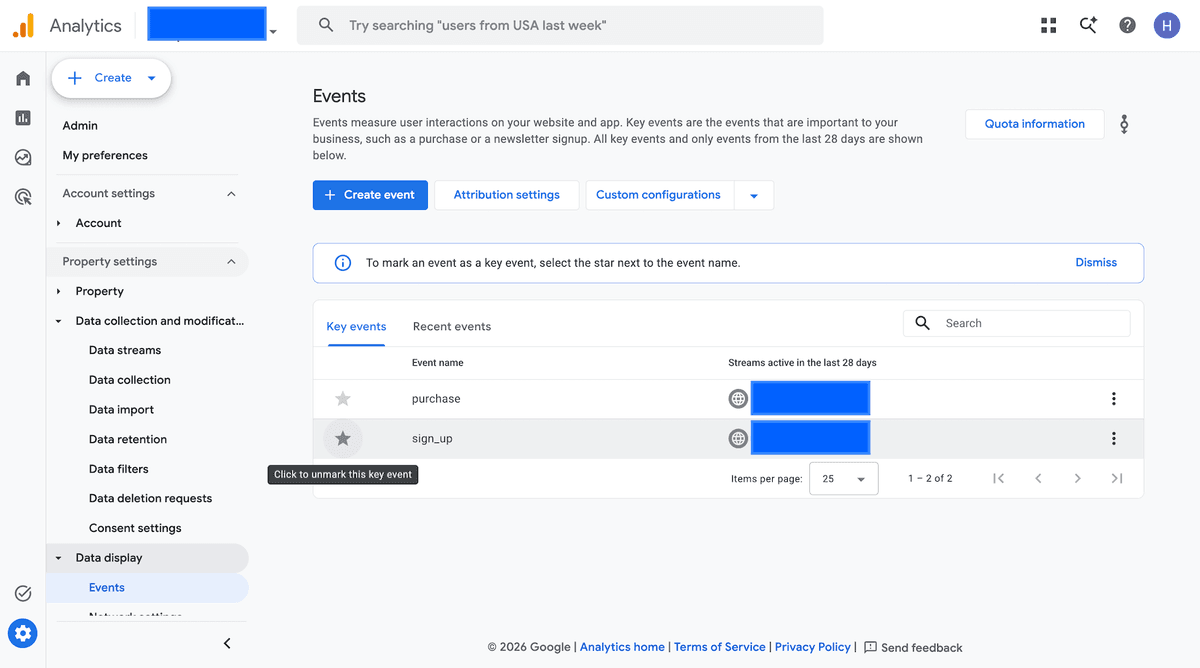
Events list with sign_up marked as a key event.
Step 7: Link Google Search Console (and Ads if you run them)
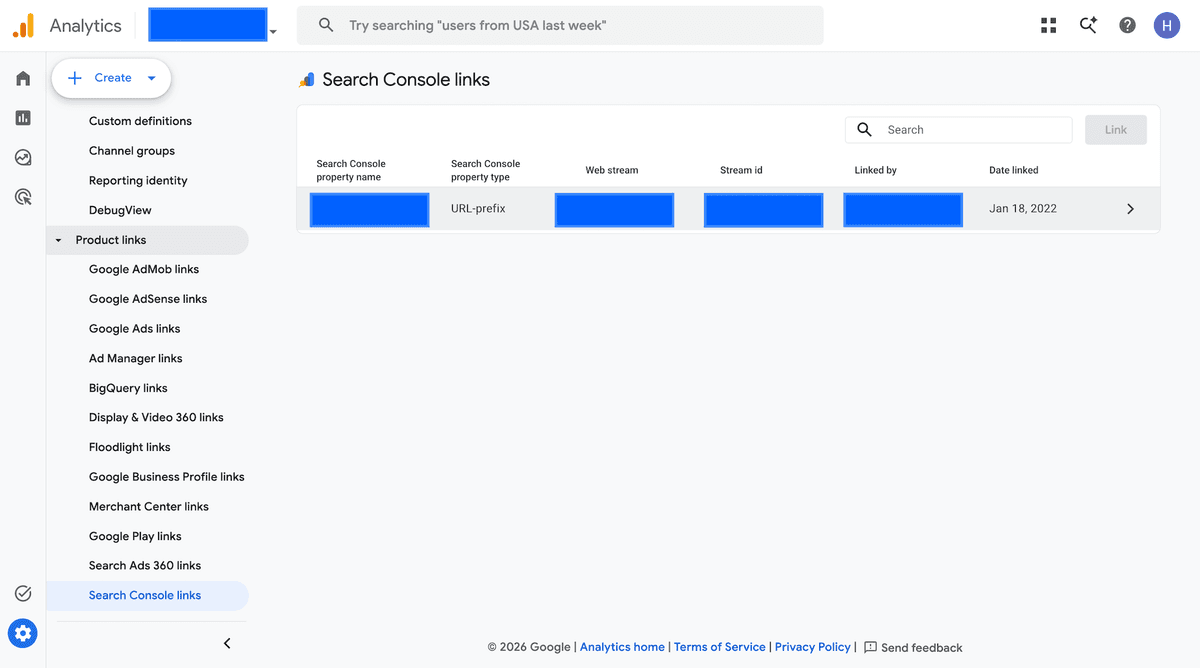
GA4 does not show organic search keywords by default. To see queries inside Analytics, link Search Console:
- Admin → Product links → Search Console links
- Link the verified Search Console property
- Choose the matching web data stream
- Confirm
After a day or two, Search Console reports appear under Acquisition. That is one of the most useful GA4 setups for SEO-focused sites.
If you run Google Ads, link that too under Product links. It unlocks campaign cost data and remarketing audience export.
How to use Google Analytics reports (the ones that matter)
You can ignore half the sidebar for the first month. These five reports cover most day-to-day decisions.
1. Realtime
Path: Reports → Realtime
Use it to confirm tracking after launches, campaigns, or code changes. It is a health check, not a strategy report.
2. Traffic acquisition
Path: Reports → Acquisition → Traffic acquisition
This answers: where did sessions come from?
Look at Session default channel group first:
- Organic Search
- Direct
- Paid Search
- Organic Social
- Referral
Sort by sessions, then check key events and engagement rate by channel. That alone tells you whether SEO, ads, or social is carrying the week.
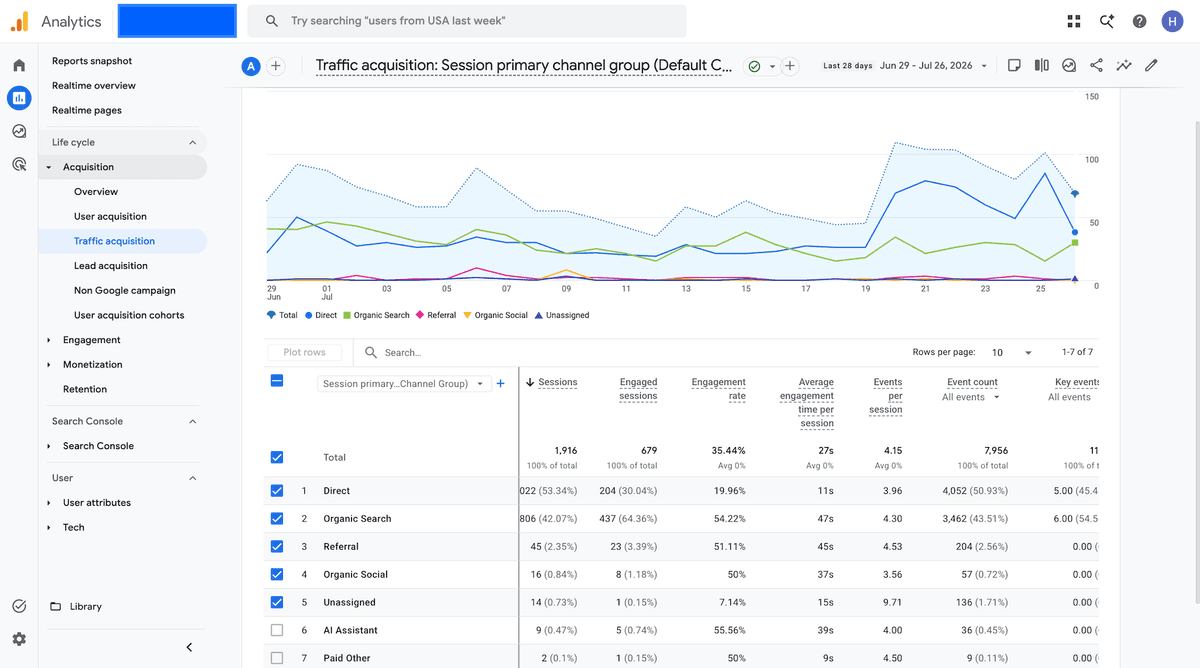
Traffic acquisition report by Session primary channel group.
3. Pages and screens
Path: Reports → Engagement → Pages and screens
This answers: which pages get views and hold attention?
Useful for content audits and finding weak pages that get traffic but weak engagement. Pair it with your content calendar instead of staring at vanity pageview totals.
4. Landing page
Path: Reports → Engagement → Landing page (add from the library if it is not already in your navigation)
This answers: which entry pages start sessions?
Landing page is the right report for SEO and paid landing performance. Pages and screens measures all views. Landing page measures first page of the visit. People mix these up constantly.
5. User attributes and tech
Path: Reports → User attributes / Tech
Country, device, browser, operating system. Useful when mobile conversion is soft, or when one country suddenly spikes. Demographics often need Google signals enabled and can be sparse on smaller sites.
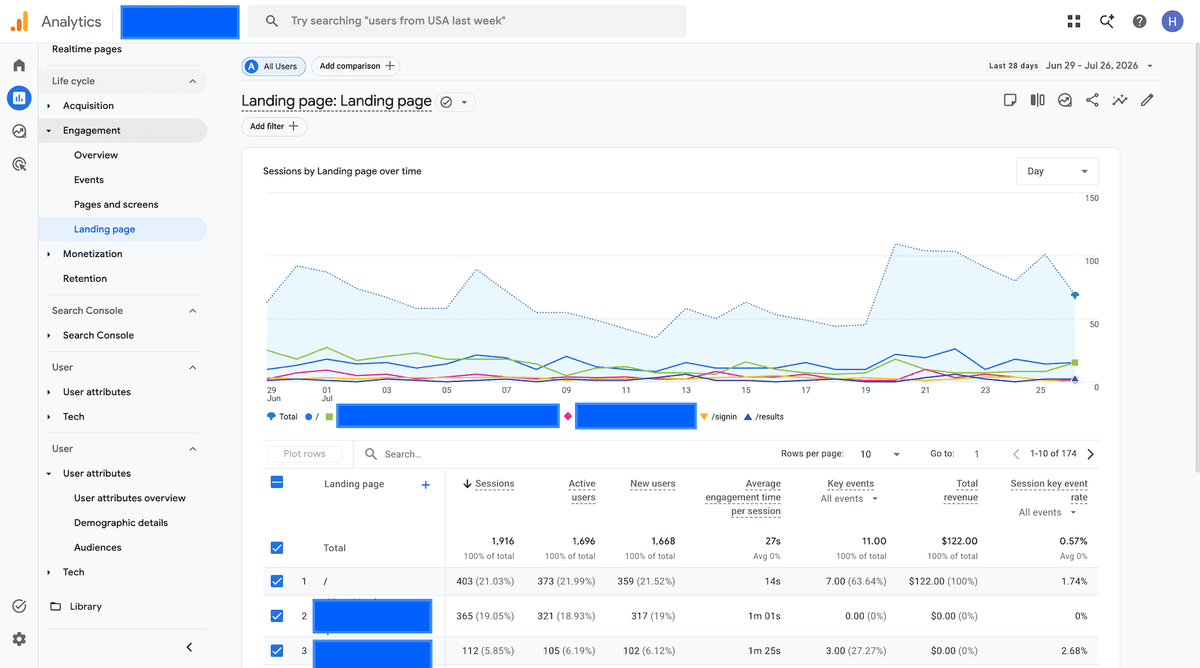
Landing page report sorted by sessions, with key events visible.
Reports vs Explore
Reports are the pre-built views. Fast, standardized, good enough for weekly check-ins.
Explore (Explorations) is the blank canvas: funnels, pathing, free-form tables, cohorts. This is where analysts live. If you only need "top sources and top pages," you may never need Explore. If you need a multi-step signup funnel with drop-offs, Explore is the tool.
For funnel thinking outside GA4, we also cover funnel analysis in plain language.
GA4 metrics beginners mix up
A short vocabulary cheat sheet:
| Term | What it means in practice |
|---|---|
| Active users | People who had an engaged session (default user metric in many reports) |
| Sessions | A visit window, usually resets after 30 minutes of inactivity |
| Engagement rate | Share of sessions that lasted 10+ seconds, had a key event, or viewed 2+ pages |
| Bounce rate | Still available, but engagement rate is the clearer default |
| Events | Every tracked interaction |
| Key events | The events you marked as business-critical conversions |
| Views | Page or screen views |
If a report looks "wrong," check the metric definitions before you blame the install. Many "bugs" are renamed concepts from Universal Analytics.
Common mistakes that break beginner setups
1. Double-installing the tag Direct gtag plus GTM for the same property doubles numbers. Pick one method.
2. Leaving data retention at 2 months Change it to 14 months on day one.
3. Tracking everything, deciding nothing Fifty custom events with no key events is noise. Start narrow.
4. Reading Pages and screens when you mean Landing page Different questions. Different reports.
5. Ignoring consent and privacy setup If you serve EU visitors, cookie consent and data transfer rules matter. GA4 is not automatically GDPR-safe. Read our Google Analytics GDPR guide before you treat the free plan as risk-free. Cookieless options are covered in cookieless analytics.
6. Judging a brand-new property after one day Give acquisition and engagement reports a few days of traffic before you make strategy calls.
7. Filtering nothing Add an internal traffic filter for your office or home IP once you are comfortable in Admin. Otherwise your own clicks inflate the charts.
When Google Analytics is the right tool
GA4 is a strong fit when:
- You need a free tool and can invest time in setup
- You live inside Google Ads and Search Console
- You want deep custom reporting and Explorations
- Someone on the team already knows GA4
- You need enterprise-style flexibility (or you are evaluating GA360 pricing for very large traffic)
In those cases, learn the workflow above and keep your property clean. The tool can do a lot once the foundation is right.
When a simpler analytics tool makes more sense
Here is the part most GA4 tutorials skip.
A lot of teams do not need Explorations, custom dimensions, and a nested report library. They need answers:
- How many people visited?
- Where did they come from?
- Which pages matter?
- Who signed up or paid?
- Which channel actually drives revenue?
GA4 can answer those questions. It just makes you work for them.
That is why many founders, indie hackers, and small marketing teams switch to simpler tools. Not because they hate data. Because they want to use data without becoming a part-time analyst.
Seline is built for that job:
- One clean dashboard instead of nested report trees
- Fast setup with a lightweight script
- Privacy-friendly, cookieless by default (cookie mode available if you need it)
- Traffic, funnels, journeys, and revenue analytics in one place
- Natural-language filtering when you do not want to fight dimension menus
If you have spent an afternoon hunting for a number that should have been obvious, that frustration is the product signal. Compare options in our Google Analytics alternatives roundup, or browse simple web analytics picks if you already know you want something lighter.
You can also run both for a while. Keep GA4 for Ads and Search Console workflows. Use Seline as the dashboard you actually open every morning.
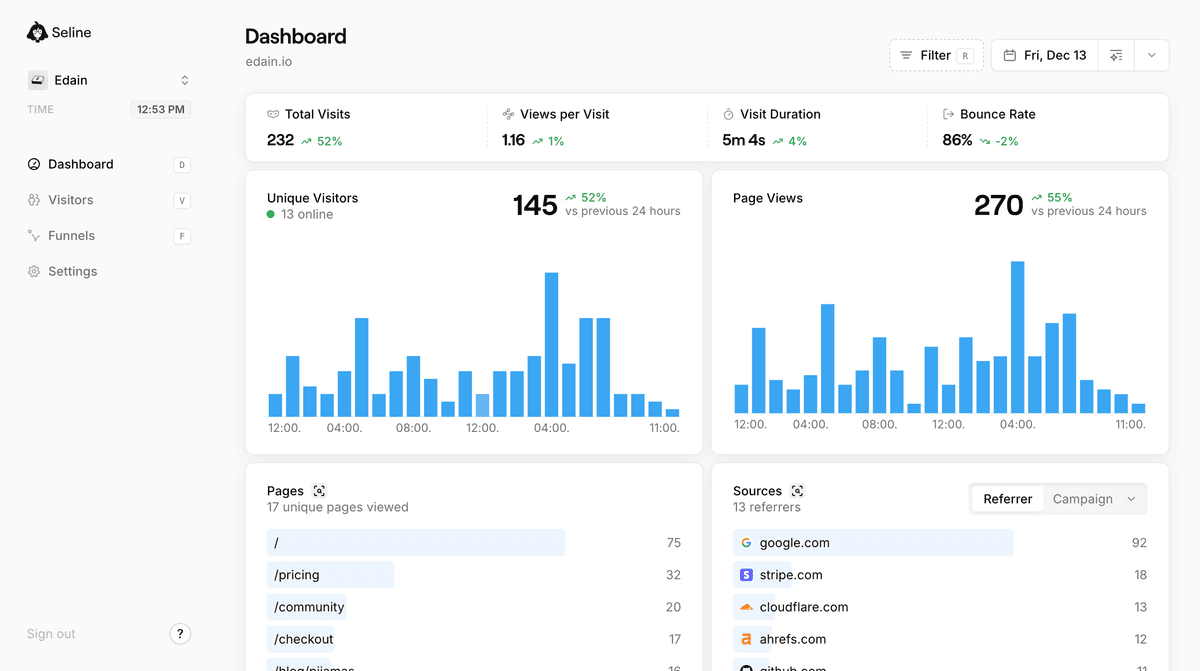
Seline dashboard: the same core questions, without the GA4 learning curve.
Want analytics you will actually open every day?
Sign up for Seline now - no credit card required. Cookieless, privacy-friendly, independent.
Get started
A simple weekly Google Analytics routine
Once setup is done, do not live in GA4 all day. Use a short weekly loop:
- Traffic acquisition: Which channels grew or dropped?
- Landing pages: Which entry pages gained sessions and key events?
- Top pages: What content deserves a refresh or internal links?
- Key events: Did signups, demos, or purchases move with traffic?
- One action: Ship one change based on the data (fix, CTA, page, campaign)
That routine beats opening twenty Explore reports and changing nothing.
For broader tool context, see our web analytics tools comparison.
FAQ: How to use Google Analytics
Is Google Analytics free?
Yes. Standard GA4 is free. Google Analytics 360 is the paid enterprise tier and usually starts in six-figure annual territory. Details are in our Google Analytics pricing breakdown.
How long does GA4 setup take?
A basic install can take 15 to 30 minutes. A useful setup (key events, Search Console, retention, filters) usually takes longer the first time, especially if you use Google Tag Manager.
Do I need Google Tag Manager?
No. Direct install is fine for simple sites. GTM is better when you expect multiple tags or frequent tracking changes.
Why do my numbers look different from another tool?
Different tools define sessions, users, and bot filtering differently. Ad blockers also remove some GA hits. Compare trends, not exact session totals across products.
Can I use Google Analytics and Seline together?
Yes. Many teams keep GA4 for Google ecosystem reporting and use Seline for a clearer daily view of traffic, funnels, and revenue.
Final takeaway
Learning how to use Google Analytics in 2026 means learning GA4: create a property, install one clean tag, verify realtime data, enable Enhanced Measurement, extend data retention, mark a few key events, and live in Acquisition plus Landing page reports.
Do that well and GA4 becomes useful.
If the interface still costs more time than the insights are worth, that is not a personal failure. It is a product fit problem. Start with the setup in this guide, then decide whether you want to keep climbing the GA4 learning curve or switch to something built to be understood on the first visit.